It’s an important test that requires preparation. Since it is a computer-based exam, The test questions are scrambled to protect its integrity. We recommend reading the following articles to know more about the exam and learn key strategies that’ll help you make big improvements during the actual tests.
This is Part-1 of our free GED reviewer for Science. Topics included in this review material are Life Science, Physical Science, Earth and Space Science, and Science Practices. The exam is designed to assess your ability to read, understand, and apply scientific concepts and principles.
GED Ready Science reviewer
The table below indicated the eye color of the two parents. One of the parents has blue eyes and carries a recessive gene of green eyes represented by “a”.
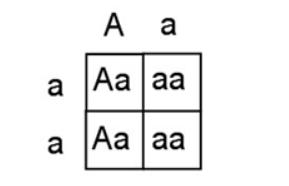
Question 1. What is the probability that a biological child of these parents will have blue eyes?
A. 25%
B. 50%✅
C. 100%
D. 0%
Below is the chemical equation for photosynthesis.
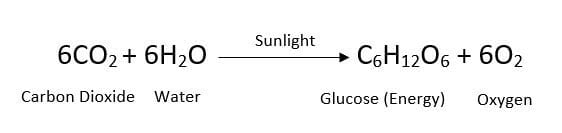
Question 2. Which of the following statements about photosynthesis is correct?
A. When 6 molecules of water are used, 1 molecule of glucose is produced✅
B. When 6 molecules of carbon dioxide are used, 1 molecule of oxygen is produced
C. When 1 molecule of glucose is produced, 12 molecules of oxygen are used
D. When 1 molecule of water is used, 1 molecule of glucose is produced
Observe the given food web below and answer the question that follows. In an ecosystem, producers convert the sun’s energy into a usable source for other organisms. Primary consumers eat the producers, secondary consumers eat primary consumers, and tertiary consumers eat secondary consumers. Some organisms eat more than one type of organism in the food web. Look at the food web below. Notice that the lion is both a scavenger and a secondary consumer. Thus, they may fill more than one role in the ecosystem.
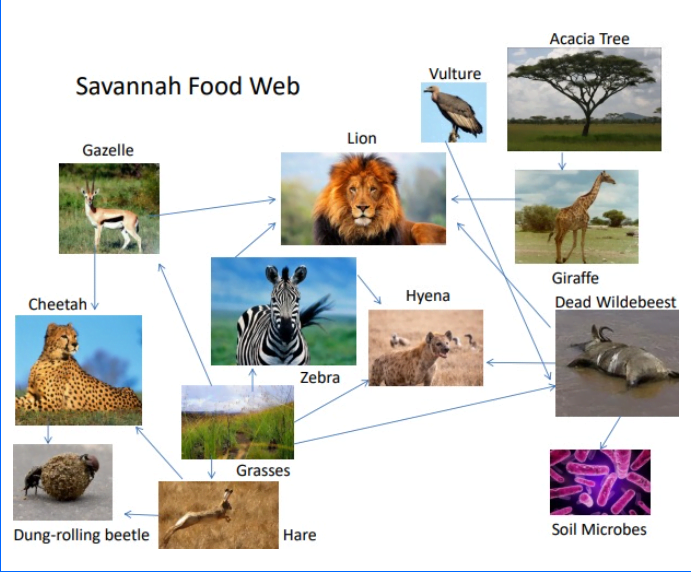
Question 3. Which of the following organisms fill more than one role in this ecosystem?
A. Cheetah
B. Dung-rolling Bettle
C. Giraffe
D. Hyena✅
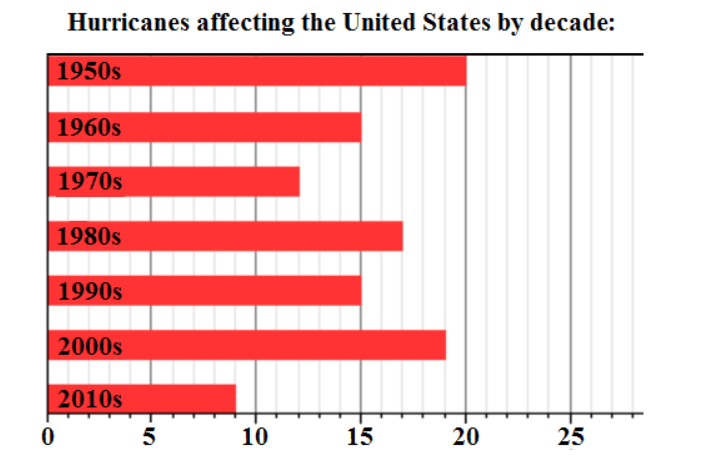
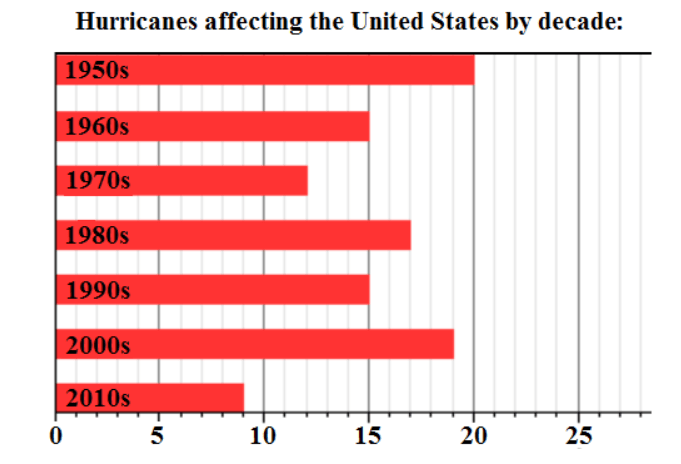
Question 4. Observe the given graph below. What is the median number of hurricanes per decade?
A. 15✅
B. 17
C. 15.5
D. 15.29
Battery companies make impressive claims about how long their batteries will last. A student decided to test the running time of different batteries to determine which battery lasts the longest. The student tested 6 different batteries, 4 brand names and 2 generics, using flashlights. The results show that the battery referred to as Name Brand A lasted the longest, with 101 hours of runtime:
| Flashlight | Battery | Runtime in Hours |
|---|---|---|
| Gearlight Super Light | Brand A | 101 |
| SureFire | Brand B | 99 |
| Maglight | Brand C | 80 |
| Bright Star | Brand D | 75 |
| SureFire | Generic A | 30 |
| Bright Star | Generic B | 25 |
Question 5. It could be argued that this experiment was not set up using the proper experimental protocol. What would need to change in the experiment for the results to be valid?
A. Only two groups should have been tested at a time
B. The same battery should have been used in each flashlight
C. The batteries should have all been either name-brand or generic
D. The same flashlight should have been used to test each battery✅
Question 6. In a chemistry experiment, the students pour 1025 milliliters of water into a beaker and mixed it with motor oil that contains 175 milliliters. (1 liter = 1000 milliliters). After adding the water, how many liters of liquid is in the beaker?
A. 1,200,00
B. 1,200
C. 1.2✅
D. 0.12
Read the paragraph below and answer the question that follows.
In an ecosystem, producers convert the sun’s energy into a usable source for other organisms. Primary consumers eat the producers, secondary consumers eat primary consumers, and tertiary consumers eat secondary consumers. Some organisms eat more than one type of organism in the food web. Look at the food web below. Notice that the lion is both a scavenger and a secondary consumer. Thus, they may fill more than one role in the ecosystem.
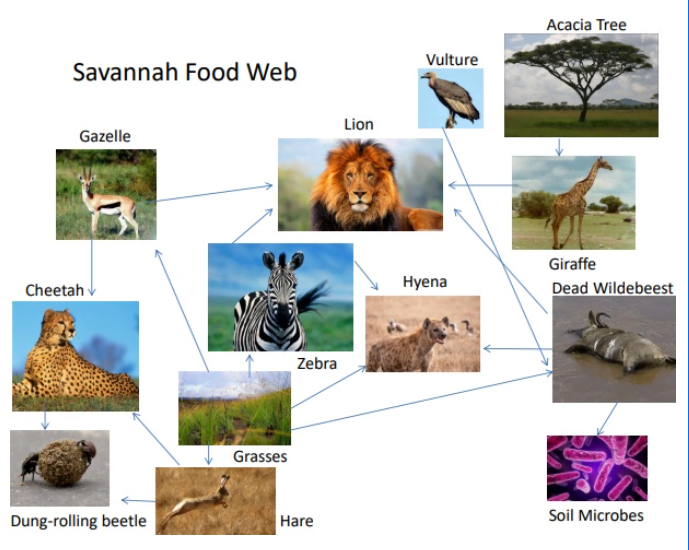
Question 7. If additional cheetahs were introduced into this ecosystem, shortly thereafter we would expect a decrease in the:
A. Hyena population
B. Hare population✅
C. Lion population
D. Dung-rolling Beetle
Question 8. Observe the graph below. What is the range of this data set?
A. 20
B. 15
C. 11✅
D. 9
Read the passage below and answer the question that follows.
Genetically modified crops and livestock offer the possibility of greater yield and food quality, reductions in pesticide use, and higher profits for agricultural businesses. They are viewed by some as a way to help reduce world hunger by increasing food production and reducing losses to pests and varying environmental conditions. Each year, industrial agriculture relies more heavily on genetically modified crops. There are some concerns about our increasing use of genetically modified crops and livestock, including their safety for human consumption and their effects on the environment.
Question 9. Based on the passage above, if genetically modified crops were to be banned, what could be the largest negative impact to humans?
A. Decreases in food production worldwide✅
B. Introduction of new allergens into the food supply
C. Increase in the amount of beneficial insects
D. Loss of genetic diversity in food crops
Wavelengths are measured in nanometers (nm). Each color on the visible spectrum has a different wavelength. The human eye is only able to distinguish wavelengths between 400-750 nm. The approximate wavelengths of the visible spectrum are shown below:
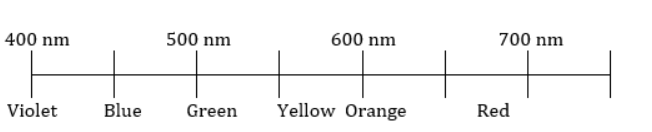
Question 10. If you were reading a scientific report, and it referred to a wavelength of 455 nm, which color would it be referring to?
A. Blue✅
B. Violet
C. Green
D. Ultraviolet
Read the given situation and answer the question that follows.
Students are conducting research with families with one brown-haired parent and one red-haired parent to understand how recessive hair-color genes interact with dominant genes. They studied the offspring of a heterozygous brown-haired man (Bb) and a homozygous recessive red-haired woman (bb). Of their four children, three have brown hair and one has red hair. The students prepared the Punnett square which is shown below.
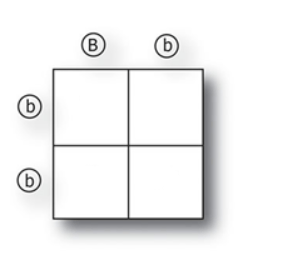
Question 11. If the couple has another child, what is the probability that this child will have brown hair?
A. 75%
B. 50%✅
C. 25%
D. 0%
Read the paragraph below and answer the question that follows.
In the 21st century, worker bees in bee colonies have been abandoning their queens and are deserting their hives in record numbers. Known as Colony Collapse Disorder, honeybees have been mysteriously disappearing across the planet—and one area that has been seriously affected is California’s Napa Valley. This issue became more commonly known when The National Agriculture Statistics Service reported in 2008 that only 2.44 million honey-producing hives were in the United States, down from 4.5 million in 1980.
There is no consensus among scientists as to what is causing Colony Collapse Disorder, though the USDA has undertaken a plan of action to stem the collapsing colonies involving several steps: survey and data collection; analysis of samples; hypothesis-driven research; mitigation and preventive action. The first findings from the USDA were published in 2009, and suggested factors such as pesticides, parasites, and pathogens may be possible causes, all of which have affected hives in Northern California.
One researcher has hypothesized that chemical pesticides are solely responsible for colony collapse disorder in Napa Valley. To test her hypothesis she is planning to run an experiment. She has obtained several healthy bee colonies and plans to expose them to pesticides while measuring the health of the colonies.
Question 12. Which additional information would be the most useful in helping her design this experiment?
A. The types of pesticides that the USDA evaluated
B. The types of pesticides that are used in Napa Valley.✅
C. The types of parasites that are present in Napa Valley.
D. The types of pathogens that are present in Napa Valley.
A laboratory produces and tests a new flu vaccine designed to prevent the influenza virus. The lab tests four dosages of the vaccine on 400 individuals, male and female, between the ages of 18 and 65 over a 3-month trial during flu season. Each group has 100 randomly assigned participants. The table shows the dosages of the flu vaccine given to each individual in the group, as well as the number of individuals that reported having influenza during the 3-month trial.
| Group | Dosage | No. of Flu Cases |
|---|---|---|
| 1 | 25 mg/day | 22 |
| 2 | 50 mg/day | 19 |
| 3 | 100 mg/day | 7 |
| 4 | 200 mg/day | 4 |
Question 13. The laboratory has published findings in which they claim that the new flu vaccine can prevent the influenza virus. However, a competing lab has criticized the findings, claiming that there is an error in the way the groups were set up. What changes to the test setup would eliminate the source of the error?
A. Only use two groups instead of four groups so the data is easier to compare.
B. Add a fifth group to the study and set the dosage to 0 mg/day.✅
C. Test a fifth group at a higher dosage than 200 mg.
D. Make the difference in the dosage amount between the groups much larger.
A study was done to measure the effectiveness of an antibiotic on different bacteria. The antibiotic Vancomycin was tested on 3 types of bacteria: Enterococcus, Staphylococcus, and Streptococcus. Bacterial growth was measured at 3 different durations of time exposure to the antibiotic: 1 hour, 24 hours, and 7 days. The rate of bacterial growth was measured by bacterial colony size at each time interval. The data for each duration was calculated and compiled into the graph shown below. As a control, each bacteria species was also grown with no exposure to the antibiotic. This control culture was measured after 7 days.
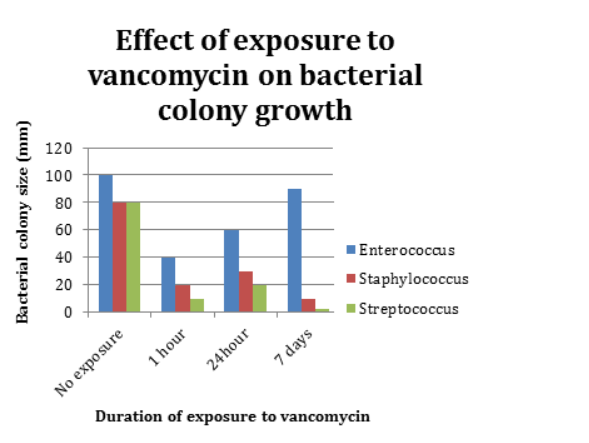
Question 14. What are the independent and dependent variables in this experiment?
A. The independent variable is the duration of exposure to Vancomycin; the dependent variable is the type of bacteria.
B. The independent variable is the bacterial colony size; the dependent variable is the type of bacteria.
C. The independent variable is the bacterial colony size; the dependent variable is the duration of exposure to Vancomycin.
D. The independent variable is the duration of exposure to Vancomycin; the dependent variable is bacterial colony size.✅
The graph below shows the population of fur seals on one of the Pribilof Islands, a group of volcanic islands near the coast of Alaska. Scientists believe that fur seals first arrived on this island in the year 1902. The red circles are population estimates and the red line is the population trend line.
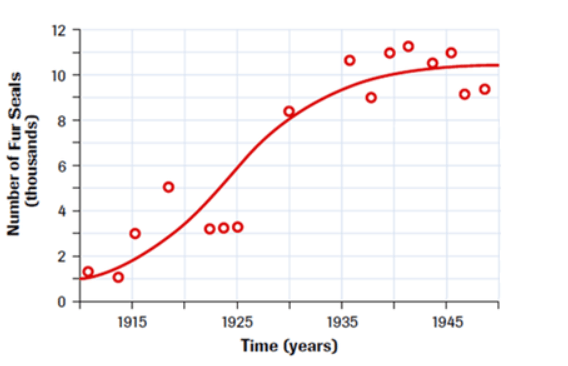
Question 15. What is the island’s approximate carrying capacity for fur seals?
A. 11,500
B. 10,500✅
C. 6,000
D. 1,500
Question 16. What do you call an animal that exclusively feeds on plants?
A. Primary Consumers✅
B. Secondary Consumers
C. Tertiary Consumers
D. Primary Producers
Observe the given data below and answer the question that follows.
| Racer | Distance | Time |
|---|---|---|
| 1 | 1550 | 103 |
| 2 | 1550 | 110 |
| 3 | 1600 | 116 |
| 4 | 1600 | 125 |
| 5 | 1600 | 116 |
| 6 | 1600 | 144 |
velocity (m/s) = distance (m) / time (s)
Question 17. What is the mean (time, in seconds) for all of the bicycle racers?
A. 714
B. 144
C. 119✅
D. 116
A cladogram is a diagram that organizes species into groups based on their similarities. It also shows evolutionary relationships among the groups.
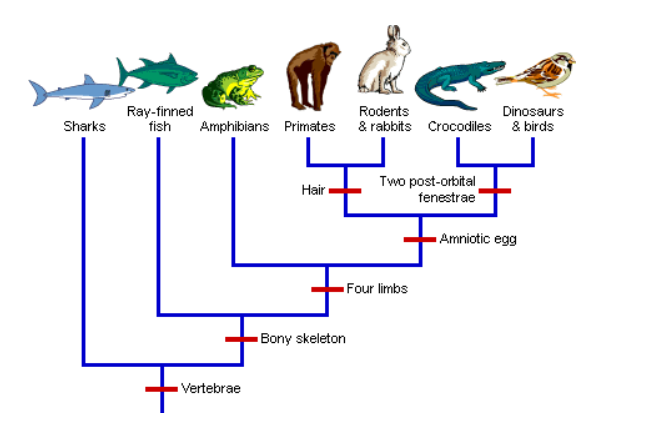
Question 18. Based on the information in this cladogram, which of these statements is true?
A. Dinosaurs are more closely related to crocodiles than they are to amphibians.✅
B. Ray-finned fish have an amniotic egg.
C. Primates evolved from sharks
D. The original ancestor of all the species on the cladogram had a bony skeleton.
A study was done to measure the effectiveness of an antibiotic on different bacteria. The antibiotic Vancomycin was tested on 3 types of bacteria: Enterococcus, Staphylococcus, and Streptococcus. Bacterial growth was measured at 3 different durations of time exposure to the antibiotic: 1 hour, 24 hours, and 7 days. The rate of bacterial growth was measured by bacterial colony size at each time interval. The data for each duration was calculated and compiled into the graph shown below. As a control, each bacteria species was also grown with no exposure to the antibiotic. This control culture was measured after 7 days.
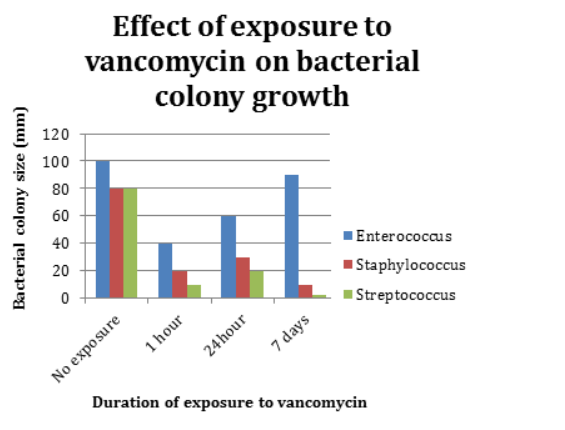
Question 19. Based on these results, Vancomycin is most effective against:
A. Staphylococcus
B. Streptococcus✅
C. Enterococcus
D. It is equally effective against Staphylococcus and Streptococcus.
Fahrenheit is a thermodynamic temperature scale, where the freezing point of water is 32 degrees Fahrenheit (°F) and the boiling point is 212°F (at standard atmospheric pressure). Celsius also called the centigrade temperature scale, is a scale based on 0° for the freezing point of water and 100° for the boiling point of water. In order to convert Fahrenheit to Celsius, the following formula can be used:

Question 20. A measure of 70 °F is equal to which of the following in Celsius? You may use your calculator.
A. 158°
B. 38.9°
C. 21.1°✅
D. 6.9°